
The National Betting Authority is systematically publishing quarterly reports on the Financial Results and Quantitative Data for the period starting January 2015 to the current quarter. The goal of this publication is the maximization of transparency and better public awareness.
The results for the second quarter of 2026 (April – June 2026) that are presented are derived from the detailed financial statements of Class A and B licenced bookmakers, as well as from the data that are stored to the Authority’s registry.
Comprehensive Income (Pay In)
of Class A and B Bookmakers
(APRIL – JUNE 2026)
Percentage (%) change of
Class A and B’s Pay in
(COMPARISON OF 2nd QUARTER OF 2025-2026)
Total Profit Distribution (Pay Out)
of Class A and B
(APRIL – JUNE 2026)
Percentage (%) change of
Class A and B’s Pay Out
(COMPARISON OF 2nd QUARTER 2025-2026)
Gross Gaming Revenue (GGR)
of Class A and B
(APRIL – JUNE 2026)
Profit Margins for Class A and B
(APRIL – JUNE 2026)
Betting tax (10%) on the GGR
for Class A and B
(APRIL – JUNE 2026)
Percentage (%) change of
betting tax for Class A and B
(COMPARISON OF 2nd QUARTER 2025-2026)
Number of Class A licensed bookmakers
Licensed premises
Number of Class B licensed bookmakers
(APRIL – JUNE 2026)
Number of blocked websites, which do not hold a Class B license or offer illegal betting services
CLASS Α
LICENSED PREMISES
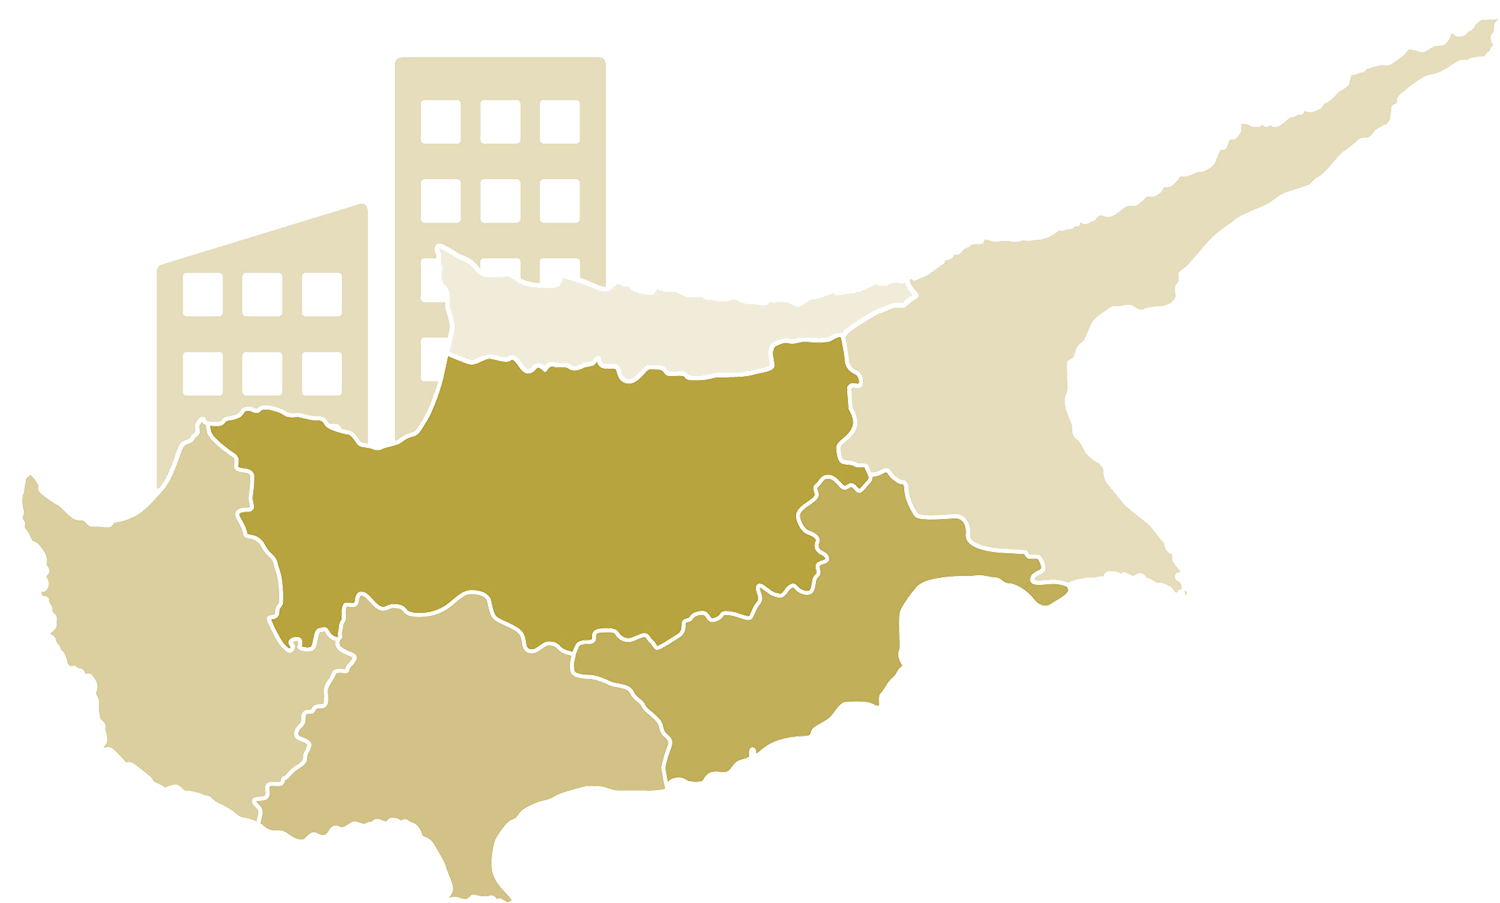
| NICOSIA | 2026 | 2025 | 2024 | 2023 |
| JANUARY – MARCH | 164 | 159 | 163 | 169 |
| APRIL-JUNE | 162 | 163 | 166 | 169 |
| JULY – SEPTEMBER | – | 165 | 167 | 169 |
| OCTOBER – DECEMBER | – | 163 | 162 | 170 |
| LARNACA | 2026 | 2025 | 2024 | 2023 |
| JANUARY – MARCH | 81 | 85 | 89 | 87 |
| APRIL-JUNE | 83 | 84 | 90 | 90 |
| JULY – SEPTEMBER | – | 83 | 90 | 88 |
| OCTOBER – DECEMBER | – | 84 | 87 | 90 |
| LIMASSOL | 2026 | 2025 | 2024 | 2023 |
| JANUARY – MARCH | 132 | 127 | 135 | 141 |
| APRIL-JUNE | 134 | 130 | 132 | 141 |
| JULY – SEPTEMBER | – | 133 | 131 | 140 |
| OCTOBER – DECEMBER | – | 135 | 129 | 139 |
| PAPHOS | 2026 | 2025 | 2024 | 2023 |
| JANUARY – MARCH | 46 | 48 | 53 | 54 |
| APRIL-JUNE | 46 | 48 | 52 | 55 |
| JULY – SEPTEMBER | – | 49 | 52 | 54 |
| OCTOBER – DECEMBER | – | 49 | 51 | 54 |
| FAMAGUSTA | 2026 | 2025 | 2024 | 2023 |
| JANUARY – MARCH | 36 | 34 | 34 | 38 |
| APRIL-JUNE | 36 | 35 | 33 | 39 |
| JULY – SEPTEMBER | – | 36 | 35 | 39 |
| OCTOBER – DECEMBER | – | 36 | 34 | 37 |
Percentage (%) change
COMPARISON OF APRIL-JUNE 2025 WITH APRIL-JUNE 2026
NICOSIA
-1%
LARNACA
-1%
LIMASSOL
3%
PAPHOS
-4%
FAMAGUSTA
3%
| QUARTER | APR-JUN 2023-2024 |
APR-JUN 2024-2025 |
APR-JUN 2025-2026 |
| NICOSIA | -2% | -2% | -1% |
| LARNACA | 0% | -7% | -1% |
| LIMASSOL | -6% | -2% | 3% |
| PAPHOS | -5% | -8% | -4% |
| FAMAGUSTA | -15% | 6% | 3% |
Archive
Period January - March 2026
The National Betting Authority is systematically publishing quarterly reports on the Financial Results and Quantitative Data for the period starting January 2015 to the current quarter. The goal of this publication is the maximization of transparency and better public awareness.
The results for the first quarter of 2026 (January – March 2026) that are presented are derived from the detailed financial statements of Class A and B licenced bookmakers, as well as from the data that are stored to the Authority’s registry.
Comprehensive Income (Pay In)
of Class A and B Bookmakers
(JANUARY – MARCH 2026)
Percentage (%) change of
Class A and B’s Pay in
(COMPARISON OF 1st QUARTER 2025-2026)
Total Profit Distribution (Pay Out)
of Class A and B
(JANUARY – MARCH 2026)
Percentage (%) change of
Class A and B’s Pay Out
(COMPARISON OF 1st QUARTER 2025-2026)
Gross Gaming Revenue (GGR)
of Class A and B
(JANUARY – MARCH 2026)
Profit Margins for Class A and B
(JANUARY – MARCH 2026)
Betting tax (10%) on the GGR
for Class A and B
(JANUARY – MARCH 2026)
Percentage (%) change of
betting tax for Class A and B
(COMPARISON OF 1st QUARTER 2025-2026)
Number of Class A licensed bookmakers
Licensed premises
Number of Class B licensed bookmakers
(JANUARY – MARCH 2026)
Number of blocked websites, which do not hold a Class B license or offer illegal betting services
CLASS Α
LICENSED PREMISES
| NICOSIA | 2026 | 2025 | 2024 | 2023 |
| JANUARY – MARCH | 164 | 159 | 163 | 169 |
| APRIL-JUNE | – | 163 | 166 | 169 |
| JULY – SEPTEMBER | – | 165 | 167 | 169 |
| OCTOBER – DECEMBER | – | 163 | 162 | 170 |
| LARNACA | 2026 | 2025 | 2024 | 2023 |
| JANUARY – MARCH | 81 | 85 | 89 | 87 |
| APRIL-JUNE | – | 84 | 90 | 90 |
| JULY – SEPTEMBER | – | 83 | 90 | 88 |
| OCTOBER – DECEMBER | – | 84 | 87 | 90 |
| LIMASSOL | 2026 | 2025 | 2024 | 2023 |
| JANUARY – MARCH | 132 | 127 | 135 | 141 |
| APRIL-JUNE | – | 130 | 132 | 141 |
| JULY – SEPTEMBER | – | 133 | 131 | 140 |
| OCTOBER – DECEMBER | – | 135 | 129 | 139 |
| PAPHOS | 2026 | 2025 | 2024 | 2023 |
| JANUARY – MARCH | 46 | 48 | 53 | 54 |
| APRIL-JUNE | – | 48 | 52 | 55 |
| JULY – SEPTEMBER | – | 49 | 52 | 54 |
| OCTOBER – DECEMBER | – | 49 | 51 | 54 |
| FAMAGUSTA | 2026 | 2025 | 2024 | 2023 |
| JANUARY – MARCH | 36 | 34 | 34 | 38 |
| APRIL-JUNE | – | 35 | 33 | 39 |
| JULY – SEPTEMBER | – | 36 | 35 | 39 |
| OCTOBER – DECEMBER | – | 36 | 34 | 37 |
Percentage (%) change
COMPARISON OF JANUARY-MARCH 2025 WITH JANUARY-MARCH 2026
NICOSIA
3%
LARNACA
-5%
LIMASSOL
4%
PAPHOS
-4%
FAMAGUSTA
6%
| QUARTER | JAN-MAR 2022-2024 |
JAN-MAR 2023-2024 |
JAN-MAR 2024-2025 |
JAN-MAR 2025-2026 |
| NICOSIA | -2% | -4% | -2% | 3% |
| LARNACA | 2% | 2% | -4% | -5% |
| LIMASSOL | 10% | -4% | -6% | 4% |
| PAPHOS | 2% | -2% | -9% | -4% |
| FAMAGUSTA | -6% | -11% | 0% | 6% |
Archive
The National Betting Authority has prepared the first publication of the quarterly Financial Results and Quantitative Data for the period January 2015- March 2017, which will act as a basis for the systematic communication of quarterly results, whose ultimate goal is the maximization of transparency and better public awareness.
The results that are presented are derived from the detailed financial statements of Class A and B licenced bookmakers, as well as from the data that are stored to the Authority’s registry.
Compreshensive Income (Pay in) of Class A and B Bookmarkers
(JAN – MAR 2017)
Percentage (%) change
of Class A and B’s Pay in
(COMPARISON OF 1ST QUARTER 2016 -2017)
Total Profit Distribution (Pay Out)
of Class A and B
(JAN – MAR 2017)
Percentage (%) change
of Class A and B’s Pay out
(COM PARISON OF 1ST QUARTER 2016 -2017)
Gross Gaming Revenue (GGR)
of Class A and B
(JAN – MAR 2017)
Prof it Margins
(JAN – MAR 2017)
Betting tax (10%) on the GGR
for Class A and B
(JAN – MAR 2017)
Percentage (%) change of
betting tax for Class A and B
(COMPARISON OF 1ST QUARTER 2016 – 2017)
Number of Class A licensed bookmakers
Licensed premises
Number of Class B licensed bookmakers
Number of Blocked websites, which do not hold a Class B license or offer illegal betting services
CLASS Α
LICENSED PREMISES
NICOSIA 2015 2016* 2017
JANUARY – MARCH 189 197 180
APRIL – JUNE 187 196
JULY – SEPTEMBER 195 195
OCTOBER – DECEMBER 197 200
LARNACA 2015 2016* 2017
JANUARY – MARCH 89 98 93
APRIL – JUNE 96 95
JULY – SEPTEMBER 90 95
OCTOBER – DECEMBER 97 98
LIMASSOL 2015 2016* 2017
JANUARY – MARCH 173 171 164
APRIL – JUNE 171 176
JULY – SEPTEMBER 169 178
OCTOBER – DECEMBER 165 181
PAPHOS 2015 2016* 2017
JANUARY – MARCH 55 61 59
APRIL – JUNE 54 65
JULY – SEPTEMBER 58 64
OCTOBER – DECEMBER 58 69
FAMAGUSTA 2015 2016* 2017
JANUARY – ΜΑΡΤΙΟΣ 36 48 45
APRIL – ΙΟΥΝΙΟΣ 40 44
JULY – SEPTEMBER 41 45
OCTOBER – DECEMBER 42 43
PERCENTAGE (%) CHANGE
JANUARY – MARCH 2015-2017
NICOSIA
-4.76%
LARNACA
4.49%
LIMASSOL
-5.20%
PAPHOS
7.27%
FAMAGUSTA
25.00%
| QUARTER | JANUARY- MARCH 2015-2016 |
JANUARY- MARCH 2016-2017 |
JANUARY- MARCH 2015-2017 |
| NICOSIA | 4.06% | -8.89% | -4.76% |
| LARNACA | 9.18% | -2.15% | 4.49% |
| LIMASSOL | -1.17% | -7.32% | -5.20% |
| PAPHOS | 9.84% | -10.17% | 7.27% |
| FAMAGUSTA | 25.00% | 2.22% | 25.00% |